To answer the questions above and critically — to have confidence in my findings, I would need to do some research.
One of my favourite pieces I took from my UX course was this quote by Founder and UX Expert Colman Walsh
“If you’re not doing research, you’re not doing UX.”
It’s a great, simple way of explaining how important this part of the process really is. As a UX/UI Designer I’m always empathising with users, trying to understand their needs and advocating for them. Research is a core part of that process.
In the project I carried out various pieces of research in order to make sure my product would be
- Viable – the product needs to make business sense
- Feasible – designing and building this needs to be achievable
- Desirable – users need to want to use the product that I’m designing
With these key points in mind, I set about collecting as much research as I could. Some examples are below.
Usability Test
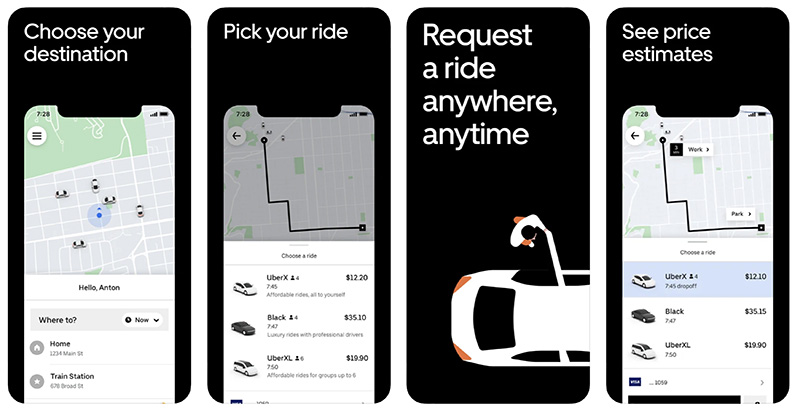
The idea behind this test is to get competitor apps into the hands of users. This allowed me to gain valuable insights about
- My users context of use
- Building their skills/confidence
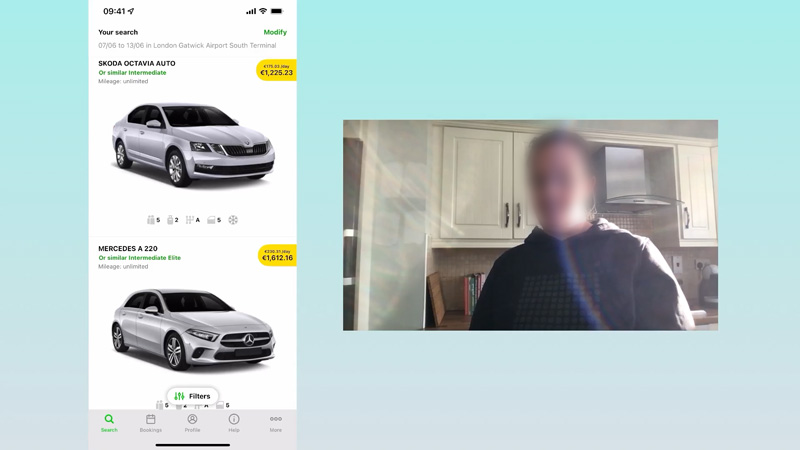
I conducted Usability Tests to learn more about my users
To carry out the tests I linked a microphone and the webcam to OBS (Open Broadcaster Software). I created a scene in OBS which included the webcam and captured the screen of an iPhone. Using a test script I then allowed the user to navigate through the journey as their actions and facial expressions were being recorded. I then used this raw material to conduct further research tasks.
Affinity Diagram
Supplied with the information from the Usability Test I was then able to make my next steps. I organised an Affinity Diagram session. I find these sessions are great for
- Brainstorming
- Applying structure to our findings
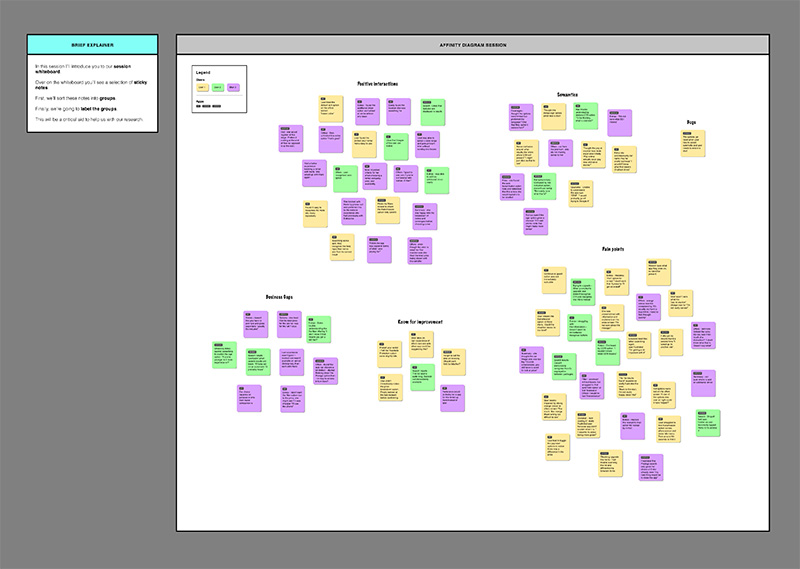
Typically, this is done in person by annotating pain points and other comments from the Usability Test and putting the post-it notes on a wall. I decided to do this digitally using Figma. Miro is also a great tool for conducting this type of research digitally.
An Affinity Diagram session helped me to track pain points
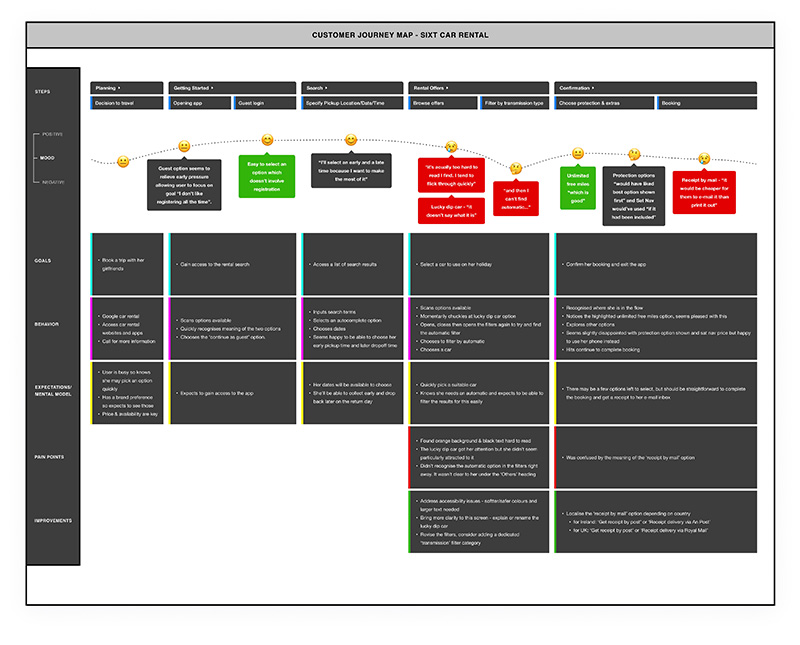
Customer Journey Map
The Customer Journey Map is another great way of reporting on an end to end flow and categorising findings by positive/negative emotions. These are all based on patterns we’ve seen in our research data. The key benefits are that this research is
- Structured
- Easy to understand
- Easy to share
- Represents the customer point of view
A customer journey map helped me to examine and structure user emotions
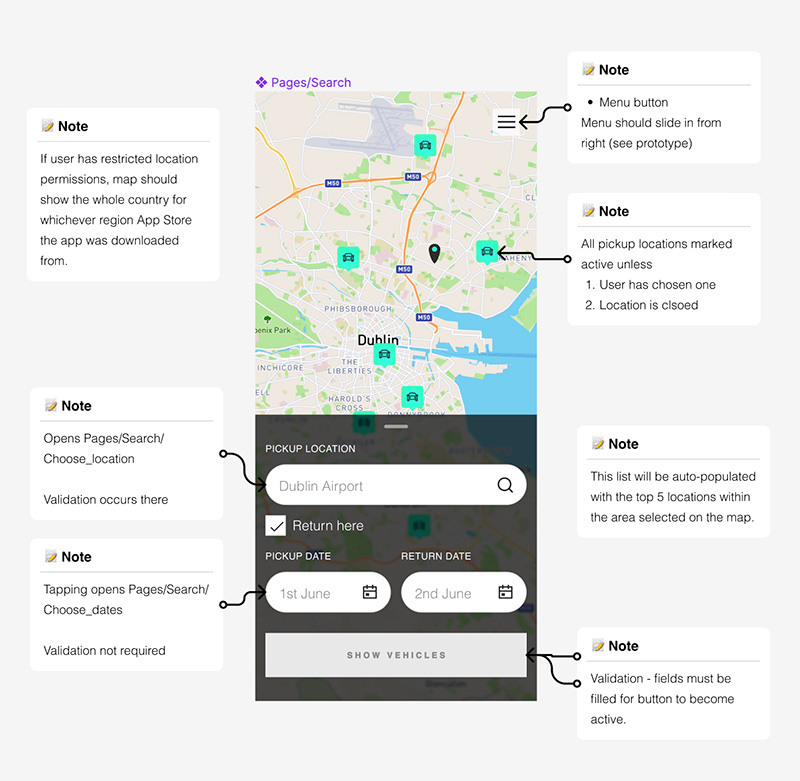
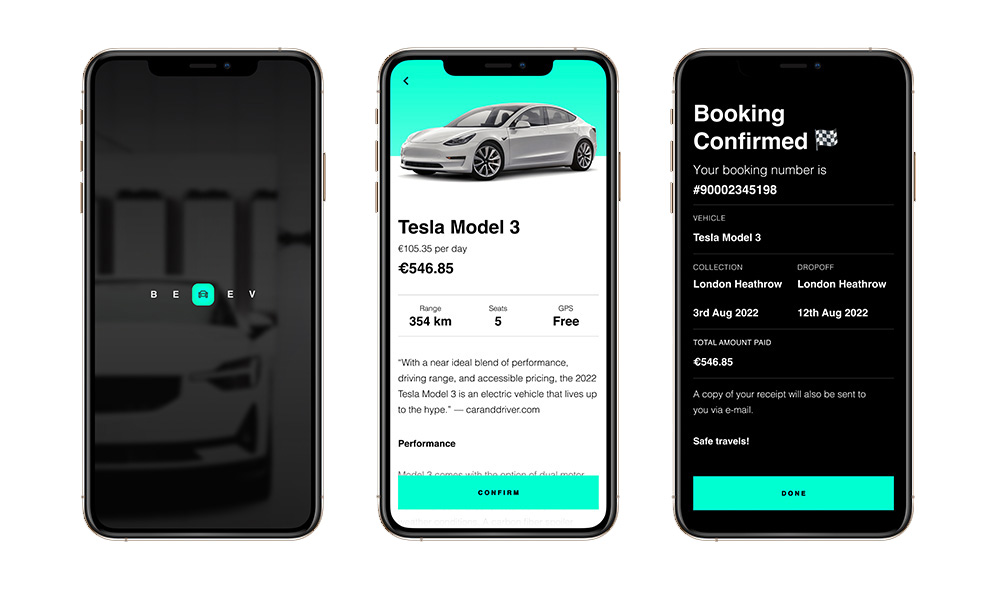
With plenty of real data now at my disposal I was able to decide I would create a brand and app for an environmentally conscious electric car rental service. It would be targeted at users of all ages over the legal driving age limit. I would need to point out some of the benefits of electric vehicles and some of the things that differentiate them from their internal combustion engine counterparts, which some users may not be aware of.